Key Aspects of YTD:

- Enhanced Decision-Making: YTD furnishes stakeholders with valuable details on income, costs, and profits, thus enabling them to make sensible financial decisions.
- Cost Efficiency: By evaluating YTD data, organisations can discover areas to save money and resources and redistribute their assets, ensuring that the expenses align perfectly with the strategic goals.
- Improved Customer Focus: This type of YTD data analysis serves as a checklist for enterprises to ensure that customer value is the only consideration, producing high customer satisfaction and a more substantial and extended workforce relationship between the two.
- Continuous Improvement: The YTD process approach allows for periodic measurement and alteration of strategies, mainly based on measuring effectiveness, ultimately resulting in continuous improvement.
- Strategic Planning: The year-to-date period is the best time for businesses to ensure smooth operations by using it as a forecasting formula and long-term decision design tool that enables businesses to navigate the market’s changimarket’stions confidently. The blog post mentions YTD as a concept that is the nature of modern enterprises. It deciphers how top managers fully utilise the potential of this technology in order to achieve proper financial clarity.
What is YTD (Year-to-Date)?

YTD, which is Year-to-Date, is an accounting term that covers the period that starts at the beginning of the fiscal year and continues to the day of the writing period. The latter is a widely used concept in financial statement applications, performance analysis, and other report processes, which are used to determine the performance of an organisation in the early part of the fiscal year. This is done by comparing the figures for the respective reporting period with last year’s figures. Year results are then used to determine the appropriate goals and strategies.
Key Components of YTD

- Performance Metrics: The YTD business’s metrics campaign is the focal point for estimating the company’s health. An example could be the year-to-date revenue, expenses, and profit margin performance that provides a company with an easily comparable view of how it is performing its goals.
- Timeframe Analysis: Understanding the YTD timeframe is crucial to accurately portray the outcomes since reporting and comparing this data is necessary. A company can consider seasonal differences and other influences that may affect the business’s performance during this period to delve more deeply into why these data sets differ from others.
- Data Aggregation: The aggregation and the consolidation of data collected from different departments are the two factors that make up the practice of collecting data. This provides a more comprehensive understanding of the organisation’s level relative to last year and a continuous holistic analysis.
Benefits of YTD

- Improved Decision-Making: YTD data enables organisations to make better decisions based on actual performance tendencies. For instance, a retailer may increase inventory levels based on YTD sales data to maximise profit during high-demand seasons.
- Cost Efficiency: The YTD analysis identifies wasteful expenditures and generates money-saving ideas. For instance, a company may find that some operation costs are above the budget threshold, which may warrant reviewing or renegotiating contracts with vendors to pursue cost efficiency.
- Enhanced Communication and Collaboration: YTD reporting is a key factor in the trend of transparent communication in the company and, hence, better interdepartmental communication. Sales teams can report the YTD performance implications to the market to infuse the concepts of collaboration and shared goals.
Core Principles of YTD

- Focus on Activities: Identifying specific activities and their contributions to business outcomes is central. By monitoring YTD reports on specific initiatives, companies can determine the effectiveness of their strategies.
- Link Activities to Costs: Establishing relationships between activities and their corresponding costs allows companies to see the affected areas and declare resources more effectively.
- Continuous Improvement: The regular review of the YTD metrics creates an environment of continuous improvement, where the need for change is underlined, and the winning strategies are supported.
Steps to Implement YTD Analysis
- Analyse Current Activities: Start by examining the existing processes and the data of the current YTD metrics being tracked. This will involve gathering data from various sectors, such as financial reports and data related to the organisation’s established Cost Drivers. By knowing why some costs go up or down in your company, you can measure performance and manage expenses much more efficiently, thus moving closer to business success.
- Implement Performance Metrics: Create a suite of high-quality metrics, primarily for calculating the effort put into evaluation. The metrics are easy to track and will help the organisation achieve its objectives.
- Engage Employees: By including workers in the management, a spirit of cooperation is awakened, resulting in their commitment to their work and thus realising better outcomes.
- Leverage Technology: Utilizing financial software and data analytics tools helps the YTD analysis process, as getting accurate reports and visuals on the spot is convenient.
Real-World Examples of YTD
- Example 1: A Retail Chain A well-known retail chain executed YTD metrics to observe season sales trends. After comparing YTD figures with the holiday sales of the previous 3 years, they managed their inventory efficiently and gained 15% of the revenue from holiday sales.
- Example 2: A Manufacturing Company A factory kept a tally of YTD production costs and spotted which lines were unproductive. Based on the findings, they made some process improvements, deducting 10% from their cost without sacrificing quality, which is clear evidence of the YTD’s impact on operations.
- Example 3: A Tech Startup A young tech company did the math to determine the cost of a new user acquisition at YTD and how many new customers were a part of that revenue, which had increased. Without YTD, the probable target for improving a CAC value is virtually impossible (Huang et al., 2019). Therefore, marketing strategies must be constantly reviewed and updated; YTD comparisons are necessary for the company’s customer cost (CAC) to improve, and its monthly revenue will not increase by 25% over the year (Vollmer et al., 2016).
In short, the YTD is a piece of advice for those who would like to see the full scope of their internal processes and discover their successes or failures (Elazameen et al., 2020). On top of this, enterprises will be able to actively manage their resources to the fullest and set their objectives in the most effective manner
Year-to-date (YTD) is a very effective strategy for organisations seeking to increase performance tracking and financial analysis. Businesses can unlock many new potential use cases through practical YTD analysis that includes figures for revenue, expenses, and profitability from the beginning of the year to today, which is accurate resource allocation and continuous improvement. Among the challenges of the marketplace that come with the growing competition is the need for efficient management practices like YTD reporting to help meet those challenges. By mastering the practice of YTD in your company, you will be able to achieve:
- Financial Transparency: The company’s conditions become apparent to staff and managers during the year, allowing them to make better decisions based on the information received.
- Proactive Performance Management: Early identification of patterns and deviations will yield the opportunity to take timely action and make the necessary changes to meet the set milestones.
- Informed Resource Allocation: Employing YTD data-driven insights to make the right decisions on which areas the resources need to be spent and enumerate mutual benefits of both efficiency and growth.
The organisation should be fully involved in using YTD reporting, as it can solve most problems at the speed of light. You deserve improved financial management from today to infinity and beyond!
]]>Key Aspects of UI:
- Enhanced Decision-Making: UI designs offer opportunities to reach the user’s mind and determine which behaviour is necessary to visualize the design choices they organically make.
- Cost Efficiency: Finding the prevailing areas of friction within the user interface is possible because businesses can manage the process more effectively, resulting in substantial savings and better resource distribution.
- Improved Customer Focus: UI designed with user experience as the primary target means that the ones that do not need such a high priority will be less used. That way, it can easily be seen that customer satisfaction is the main objective of that company.
- Continuous Improvement: Good design not only verifies test runs; the user interface should be tested before. The company should rethink which strategies work strategically for it and plan regular improvements to the user experience.
- Strategic Planning: A well-thought-out user interface will help the company forecast user engagement trends, such as ups and downs, which will, in turn, inform what users expect in the future. This blog will delve into UI principles, its importance in present business practices, and how to capture its potential for better user experience by organizations. Let’s go side by side with expert investigation and real-world examples of implementing UI strategies in your business framework!
What is UI (User Interface)?

UI (User Interface) is a user-centred design principle that communicates between end-users and digital products such as websites and apps. It refers to everything a user interacts with, including buttons, icons, sliders, text fields, and other visual elements. By properly evaluating and designing these elements, the customer’s fun, delight, and satisfaction can be maximized in a way that encourages their interaction.
Key Components of UI
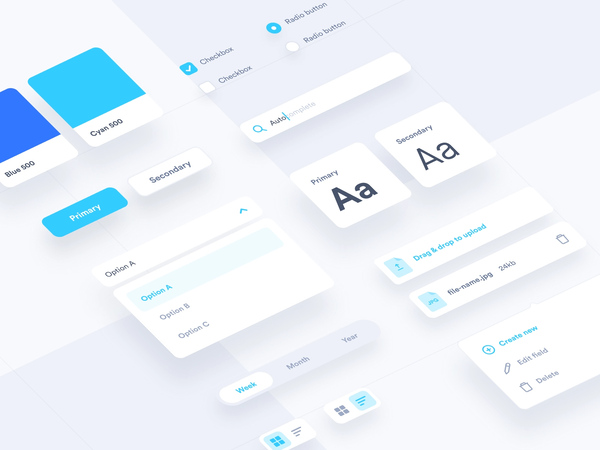
1. Visual Design: This component has a visual character because it imposes the quality of the user interface. It involves choosing the right colour schemes, typography, and layout, as the visual design allows for the most pleasing design, displaying the whole visual impression of the digital product.
2. Interaction Design: Interaction design is the process of defining the interaction between people and products. It is an area that deals with the design of interactive systems and, thus, the product’s execution.
3. Usability: Usability, which means how visitors can achieve their objectives when using a website, is very important for the success of any site. When a user interacts with a website, the site’s usability becomes easier and more efficient.
Benefits of UI

- Improved Decision-Making: UI is a part of interaction design and UX. It is concerned with the UI that a user uses to interact with a device and the visual appearance of the device. It is one of the disciplines of interaction design, processing human-computer interaction, and the design of on-screen information systems.
- Cost Efficiency: Simple, user-friendly applications enable businesses to save time and money. A good UI design makes it quicker for users to do their tasks since they can visualize the result of every action they take.
- Enhanced Communication and Collaboration: Mobile devices and gadgets have changed the way we interact and live. We cannot have a fully functional UI until we connect the dashboard’s functionality to the system’s performance.
Core Principles of UI

- Focus on Activities: Job roles and practices must be extracted from related user activities and clearly distinguished as core points. Discovering what a group of users would like to be able to do enables developers to implement a user interface that fulfils the initial requirements.
- Link Activities to Costs: The 21st century has witnessed the introduction of a new concept called the sharing economy in which companies like Uber and Airbnb rely on activity-based cost management. This enables a better view of the costs associated with different activities and helps in real-time decision-making.
- Continuous Improvement: Many apps and system improvements will likely be needed. Constant work with an idea, theurgic in all its aspects, comes out as the result of years of reading, meditation, and another kind of spiritual practice so that it can penetrate to the core of a work situation.
Steps to Implement UI

- Analyze Current Activities: Evaluate the end user experience and propose new improvement solutions for the existing interface design.
- Establish Cost Drivers: Factors regulating the expenditure of UI design and maintenance costs must be mentioned.
- Implement Performance Metrics: Configure and monitor the performance of aspects like user engagement and error rates to evaluate the UI’s effectiveness.
- Engage Employees: Employees’ participation in the UI development process helps make the collaborations with the users more real and, thus, makes them feel ownership of the product.
- Leverage Technology: Employ the best design tools or technology on the user interface to improve its features and provide the functionality and visual quality that allow the user to have a great experience.
Real-World Examples of UI

- Example 1: Airbnb: Airbnb implemented certain principles of user interface, which made the booking system more user-friendly and consequently led to increased facility use and user satisfaction.
- Example 2: Slack: Slack’s user interface is simple, which facilitates message communication that is fun to follow. This can lead to more collaboration and productivity in teams.
- Example 3: Dropbox: Dropbox developed a very clear UI design that simplified user file sharing. The easier and more intuitive Dropbox platform made using it more enjoyable for the users, increasing engagement and, thus, proving the significance of a good UI design.
It is now that the study’s preparation and final display can be articulated. The last section introduced a more descriptive approach to the topic. The study has added a new aspect to the explanation of the research. In conclusion, UI (User Interface) design is a significant approach for organizations to enhance user experience and engagement. Businesses can optimize their operation processes and decision-making opportunities by devising concrete solutions in intuitive design, employing resources for usability testing, and continually improving the UI design. Meeting the current market challenges and the fierce competition in any business, good UX design will undoubtedly be treated as a core to effectively managing the company’s product and service delivery. Adhering to the principles of UI design in business operations, you can accomplish:
- Small-scale user fulfilment due to easy and beautiful navigation and peers.
- Superior conversion rates owing to the decrease in friction in user interactions.
- There is even more brand loyalty as users are being given some points in the style and flow of the interface. According to recent research on the positive effects that a good UI design brings, the best approach would be to adopt this model right now. Make the first step to start being successful in the digital space and creating awesome user interactions!
Core Performance Enhancement Characteristics
- Enhanced Decision-Making: PI will offer the much-needed insights from data analyses, process evaluation, and other forms of empirical study. This will enable the leaders to make decisions that ensure success. It will also enable decision-makers to define trends and solutions related to issues, thereby resulting in better organizational outcomes.
- Cost Efficiency: PI identifies inefficiencies and cleans up the processes, outlining areas of probable savings and relocating resources, leading to healthier profit margins. Organizations can allocate resources to high-impact initiatives, ensuring more return on investment.
- Customer Focus: Performance Improvement ensures that everything done is aligned with customer value, assisting businesses in ensuring that initiatives focused on improving the customer experience take priority—a customer-centric approach results in more satisfied and loyal customers.
- Continuous Improvement: This approach develops a culture of frequently evaluating and reassessing strategies so that organizations remain agile and responsive in a fast-paced marketplace. Continuous growth keeps organizations ahead of industry trends.
- Strategic Plan: PI enhances accuracy in forecasts and long-range planning, preparing organizations for future problems and changes. This proactive approach helps organizations manage risks associated with changes in operations.
In this post, we will discuss Performance Improvement, its relevance in current business practice, and some ways that organizations can leverage its potential for operational efficiency. Stay with us as we provide valuable insight and practical steps toward incorporating Performance Improvement into your business strategy!
What is PI (Performance Improvement)?
PI, or Performance Indicator, is any measurable measure for evaluating how well an organization is doing or accomplishing a specific activity. Identifying the specific metrics that reflect performance in various domains can lead organizations to conclusions that drive strategic decisions and improve operational efficiencies.
Critical Components of PI:

- Component 1: Metrics Selection: Metrics selection is the process of selecting appropriate indicators that align with an organization’s goals. This is very important. Well-defined metrics allow an organization to focus on what matters and track progress.
- Component 2: Data Collection: This involves gathering the information necessary to compute the selected performance indicators. This is critical because data accuracy and timeliness underpin the reliability of the chosen indicators and, therefore, ensure informed decision-making.
- Component 3: Analysis and Reporting: This is the interpretation and reporting of performance data. Analyzing performance indicators and reporting findings support organizational transparency and accountability, leading to continuous improvement.
- Component 4: Continuous Monitoring: Performance indicator monitoring is one way the organization can stay on track. Regular evaluations help identify trends in advance and enable quick adjustments when things are headed wrong.
- Component 5: Stakeholder Engagement: Engaging stakeholders during the design and monitoring of Performance Indicators ensures everyone is focused and aware of the organization’s goals. This inclusivity can enhance motivation and accountability.
Benefits of PI
- Effective Decision Making: PI helps with making effective decisions by providing evidence about performance trends. For instance, if a sales team monitors the customer acquisition rate as its performance indicator, it can identify successful strategies and issues that require improvement for better data-driven decisions.
- Cost Efficiency: PI determines areas of inefficiency and how to distribute resources appropriately. Thus, monitoring production efficiency as a PI could uncover unnecessary costs associated with unproductive processes to streamline the organization.
- Improving Communication and Teamwork: Having performance indicators in place creates an atmosphere of openness and collective teamwork. Performance data can be shared across departments, and teams can look out for challenges and work toward common goals to ensure more cohesive organizational workings.
- Increased Accountability: Clear-cut KPIs render the organization answerable at every tier. Once employees know what they are measured against, they feel more invested in their roles.
- Agility: Tracking KPIs enables an organization to respond quickly to market changes. Agility can give the organization a competitive advantage, positioning the business to pivot as needed.
PI Principles
- Focus on Activities: It is vital to know the tangible activities that lead to performance. Organizations must focus on these activities to increase productivity and overall performance levels. Identifying high-impact actions helps efforts make a difference.
- Relating Activities to Costs: Performance management by relating activity to costs determines whether an organization properly measures cost consequences. This assessment helps identify where efficiency can be improved.
- Continual Improvement: Continuous tracking and feedback are needed to evaluate and refine performance indicators and techniques. A culture of improvement allows organizations to adapt to change and enhance overall performance.
- Alignment to Business Goals: Performance indicators should align with the organization’s overall goals to ensure that efforts contribute to achieving strategic priorities and enhance overall business performance.
- Accessibility and Comprehensibility: Simple and easy-to-understand performance indicators encourage participation and adherence. When workers understand what is being measured and why it matters, they respond positively to the assessment process.
How to Implement PI
- Review Current Work: Review current activities and identify those directly related to the organization’s goals. This provides a foundation for where PI is best suited.
- Identify Cost Drivers: Identify the factors that influence costs related to critical activities. This analysis enables proper linkage of performance data with financial metrics.
- Establish Performance Metrics: Implement relevant performance metrics aligned with organizational goals. This creates a structured way to measure efforts and identify areas needing improvement.
- Engage Employees: Involve employees to foster a sense of ownership and accountability towards achieving set performance targets. Their insights are invaluable for shaping effective strategies.
- Technology Leveraging: Utilize technology and tools to automate data collection and enhance monitoring of performance indicators. This can significantly improve the accuracy and efficiency of the process.
Practical Applications of PI

- Example 1: Manufacturing Company: A manufacturing firm used performance indicators to monitor the production lifecycle. By using equipment downtime as a key performance indicator, they identified bottlenecks affecting productivity. They implemented predictive maintenance schedules, increasing uptime by 25%.
- Example 2: Retail Chain: A retail chain tracked customer satisfaction scores as a performance indicator. Analyzing these scores revealed underperforming store locations in terms of service quality. The chain instituted a targeted training program, which led to a 15% increase in customer satisfaction across those stores within six months.
- Example 3: IT Service Provider: An IT service provider used performance indicators to analyze service response times. By setting benchmarks and closely monitoring performance, they streamlined support processes, reducing average response time from 24 hours to significantly improving client satisfaction.
- Example 4: Healthcare Facility: A healthcare system monitored patient wait times using performance measures. Using analytics, they improved workflow, decreasing mean wait times by 30% and dramatically improving patient satisfaction scores.
- Example 5: Financial Services Company: A financial services firm adopted performance indicators to assess client retention rates. Based on performance data, targeted outreach programs were initiated, resulting in a 20% higher retention rate within the same one-year period.
Performance Indicators are fundamental guides for organizations on their journey to strategic success. When properly understood and implemented, organizations can improve decision-making and efficiency, fostering a culture of continuous improvement.
Final Thoughts
The PI complete form is an excellent practice that companies, bound by the desire to improve performance, must adopt. An in-depth understanding of its core principles—process efficiency, resource allocation, and stakeholder engagement—dramatically unlocks the potential for operational processes and decision-making strategies. With market pressures and competition intensifying, investing in Performance Improvement (PI) will become a cornerstone of management success.
Key Takeaways:
- Enhanced Operational Efficiency: Streamlining workflows to reduce waste and increase productivity.
- Data-Informed Decision Making: Performance metrics help identify growth areas and focus strategic decisions.
- Better Team Engagement: Collaboration and communication across departments help employees realize common objectives.
- Increased Customer Satisfaction: Alignment of performance with customer expectations fosters loyalty and retention.
- Sustainable Success: This engenders sustainable success for individuals and organizations through a culture of constant improvement and change.
Now’s the moment to embrace Performance Improvement and experience firsthand the tremendous effects it can have on your company. Join us in taking that first small step toward changing business operations and unleashing sustainable growth today!
]]>Ready to talk with a marketing expert?

A Pragmatic and innovative way to enthrall your target group is just a click away!
Get in Touch
Rukmini Knowledge Park, Kattigenahalli, SH 104, Srinivasa Nagar, Bengaluru, Karnataka 560064
+91-990 247 8800
contact@gingermediagroup.com
Popular in Television Advertising
Udaya TV AdvertisingSun TV AdvertisingStar Plus AdvertisingTV 9 AdvertisingZee TV AdvertisingNDTV India AdvertisingColors TV AdvertisingPopular in Airport Advertising
Spice Jet AdvertisingMumbai Airport AdvertisingDelhi Airport AdvertisingEmirites AdvertisingIndiGo Airlines Domestic India AdvertisingPopular in Newspaper Advertising
Deccan Herald AdvertisingPrajavani AdvertisingThe Hindu AdvertisingEconomic Times AdvertisingDainik Jagran AdvertisingHindustan Times AdvertisingPopular in Magazine Advertising
Forbes AdvertisingCosmopolitan AdvertisingBusiness World AdvertisingVogue Magazine AdvertisingPopular in Sports Advertising
IPL AdvertisingPopular in Outdoor Advertising
Billboard AdvertisingBus Shelter AdvertisingMetro Pillar AdvertisingUnipole Advertising© Ginger Media Group 2025. All Rights Reserved.